
How Two Climate Research Interns Built a Carbon Calculator to Change Behaviour

20/09/2022
Written by Frederic Kalinke
As part of SilverRail’s ongoing mission to change the way people move and build a greener planet, we scoured the UK to find two bright sparks who were passionate about decarbonising the transport sector.
After sifting through applications, the SilverRail team were delighted to welcome Valentine Jerop and Alex Livingston as Climate Research Analysts for an intensive eight-week internship.
Both Valentine and Alex are recent graduates who focused their university studies around climate issues. Valentine studied an MSc in Environment and International Development and Alex graduated with a BSc in Environmental Science at UEA’s Climatic Research Unit. They were eager to turn their studies into action and to get a taste of working in a company that is taking a stand against climate change.
Once they were settled in, SilverRail’s newest recruits were given two research questions that would be their sole focus for the next eight weeks:
Challenge 1: How can we change people’s behaviour through the display of carbon data?
Challenge 2: How are trains better for the environment, compared with other modes of transport?
Over the course of the internship, we documented their journey to show how two ambitious graduates managed to take two research questions and evolve their findings into a working carbon calculator that has the potential to change the way people think about their transport choices.
Here’s what that journey looked like…
Challenge 1: Changing Consumer Behaviour Using Carbon Data
Before crunching any numbers or focusing on what method they should use to calculate and compare carbon emissions for trains, planes and cars, the first challenge was to understand how data can be used to influence consumer choice.
From day one, both Valentine and Alex noted that this research project was, first and foremost, a communication challenge.
While many travel companies have tried to use carbon calculators to nudge consumers towards a particular mode of transport, they often fail to account for the behavioural drivers behind decision-making. Critically, many attempts to communicate carbon emissions fail to connect the dots between the desired outcome (i.e. to encourage behaviours that reduce carbon emissions) and an individual’s motivation for being part of the solution.
Valentine and Alex recognised that overcoming this disconnect and encouraging more people to take the train involves understanding:
A) How to visualise carbon emissions in a way that makes sense to travellers
B) How to contextualise this information to promote certain behaviours (the ‘so what?’).
In essence, changing consumer behaviour using carbon data is a storytelling exercise. It involves villains (in this case, planes and cars), a conflict or challenge (slowing climate change), a confidante who provides a solution (the train), and of course, a hero who saves the day (the traveller).
Valentine commented:
“We need to make the traveller feel like a hero. Unless we create a story that connects with them on a personal level and explains how their decisions could benefit the planet, we will fail to influence consumer choice.”
Learning from Others
After recognising the importance of storytelling, the next stop on their research journey involved collecting examples of existing carbon communications and analysing what techniques they use to influence consumer choice.
Specifically, Valentine and Alex explored the behavioural tactics used in an industry that has mastered the art of storytelling — aviation.
Despite the environmental cost of aviation, the industry has a long track record of using clever messaging to keep people flying. Against all odds in an increasingly climate-aware society, planes continue to fill our skies every day and the demand for air travel is expected to increase by an average of 4.3% every year over the next two decades.
From air mile point systems to carbon offsetting schemes, gamified experiences continue to reward air travellers for their choices and keep them hooked.
However, after researching examples across both rail and aviation, Alex noticed an important difference between the two industries that presented an opportunity for their work at SilverRail. While many rail providers have adopted carbon calculators and carbon reward schemes that attempt to mimic successful examples from aviation, Alex observed that the way we frame rail needs to take an alternative angle.
He said the following:
“At the moment, it’s very hard to position flying as a green choice. As a result, rewards systems in aviation tend to focus on alleviating travellers of guilt or ‘flygskam’ (flight shame) through things like carbon offsetting. With rail, however, the focus needs to be on rewarding travellers for making good choices.
We hope our carbon calculator will demonstrate the environmental credentials of rail and, therefore, should focus on framing this information in a way that makes travellers feel good about their decision to take the train. We want to reinforce good habits.”
This train of thought landed Valentine and Alex on two key lessons:
- An individual’s carbon data should be used to quantify carbon savings from taking the train over cars and planes.
- This data should be gamified to reward travellers for their choices.
Visualising Carbon Data
The next piece of the puzzle was to think about how to present carbon emissions in imaginative ways that people can engage with.
Instead of showing X kilograms or Y cubic metres of carbon (figures that are only really useful when they’re used side-by-side with other figures to show an increase or decline in emissions), Valentine and Alex wanted to understand how the public would like to see their carbon data presented.
So, without further ado, they got to work on creating a survey that they then shared across SilverRail’s global team to get a feel for the kind of visualisation methods they could use.
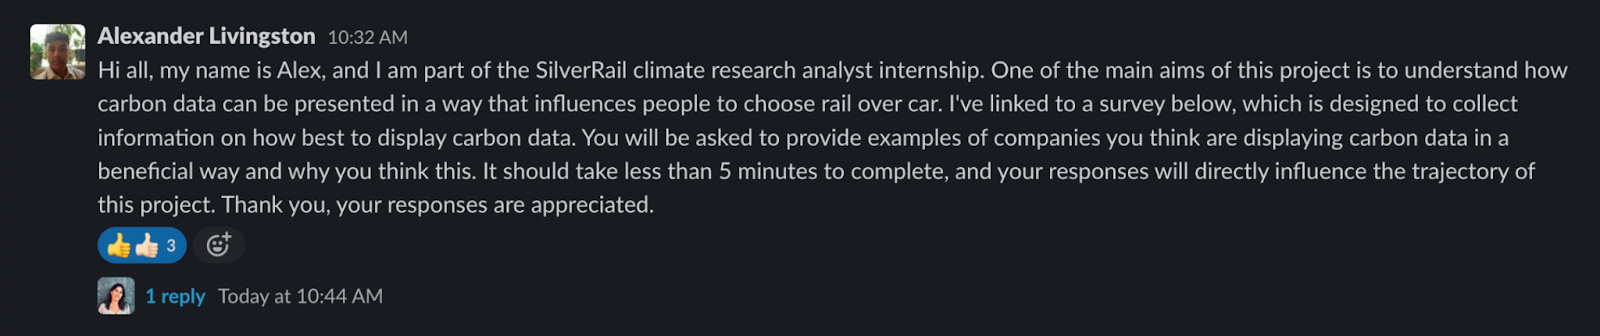
Note: The survey results came entirely from SilverRail employees. Alex pointed out that this is likely to skew the findings (compared with surveying the general public) as SilverRail employees are actively engaged in green travel debates.
After gathering the feedback, Valentine and Alex were armed with a range of ideas as to how they could bring carbon data to life. From quantifying reductions in Arctic ice melting to visualising volumes of CO2e using fire extinguishers, they found that it’s important to display data using multiple visualisations.
In short, different people react differently to different carbon visualisations.
Challenge 2: Showing That Trains Are Better for the Environment
Now that they had a better idea of how to display the carbon data, the next challenge was to get their hands on the data itself and present it in a way that rewards travellers through gamified experiences.
Unless we can confidently prove that taking the train is better for the environment than using planes or cars, old habits will die hard and the rail industry will fail to win the hearts of travellers.
However, if we can successfully compute carbon data to show significant carbon savings and map how these carbon savings relate to specific journeys that travellers relate to, combining this data with the behavioural insights covered in Challenge #1 has the potential to radically influence consumer choice.
Comparing Carbon Data for Trains, Planes & Cars
The first challenge of comparing rail carbon data to planes and cars is finding a standardised measure for emissions across all three modalities. Specifically, Valentine and Alex raised concerns about the way “carbon” is often used as an oversimplification that fails to recognise the impact of other polluting gases that contribute to climate change.
Valentine explained the following:
“Although carbon dioxide is the main greenhouse gas in terms of volume, there are many other greenhouse gas emissions that have a significant impact on climate change. Some of these gases are released in much smaller volumes than CO2 but they pack a punch. We use the term ‘Global Warming Potential’ (GWP) to describe the potency of a gas in terms of its impact on climate change for a given volume.”
In fact, some gases such as Hydrofluorocarbons (HFCs), perfluorocarbons (PFCs), and sulphur hexafluoride (SF6) are 1,000, 10,000, or even 20,000 times more powerful than CO2 at trapping heat in earth’s atmosphere.
With this in mind, Valentine and Alex decided to opt for carbon dioxide equivalents (CO2e) as the baseline metric across their carbon calculator to ensure that these additional gases were accounted for. CO2e uses the GWP index (as defined by the Intergovernmental Panel on Climate Change) to combine the weighted impacts of multiple greenhouse gases into a single metric.
Note: CO2e expresses the combined warming effect of greenhouse gases over a set period (usually 100 years) to account for the fact that some greenhouse gases remain in the atmosphere for longer than others.
Building the Carbon Calculator
After plenty of head scratching and back and forths with various members of the SilverRail team, Valentine and Alex decided to use Excel to create a prototype carbon calculator that records an individual’s rail journeys over time.
The plan was to calculate the carbon emissions from each journey and use CO2e values to compare the efficiency of choosing the train over planes and cars. This prototype would mimic a traveller’s experience of buying train tickets online and include a number of levers of behaviour change.
Levers of behaviour change are discrete intervention strategies that can be ‘pulled’ to achieve different effects. Whether it’s a financial incentive to encourage a certain action, an emotional message to trigger empathy, or leveraging social behaviours, beliefs, and expectations of others to influence an individual, Valentine and Alex were eager to design a prototype that used levers to promote more rail bookings.
The below Miro shows how they mapped out the design and UI of the Excel prototype to translate the survey findings into product decisions and compute the CO2e comparisons for an individual’s ’journey dashboard’.
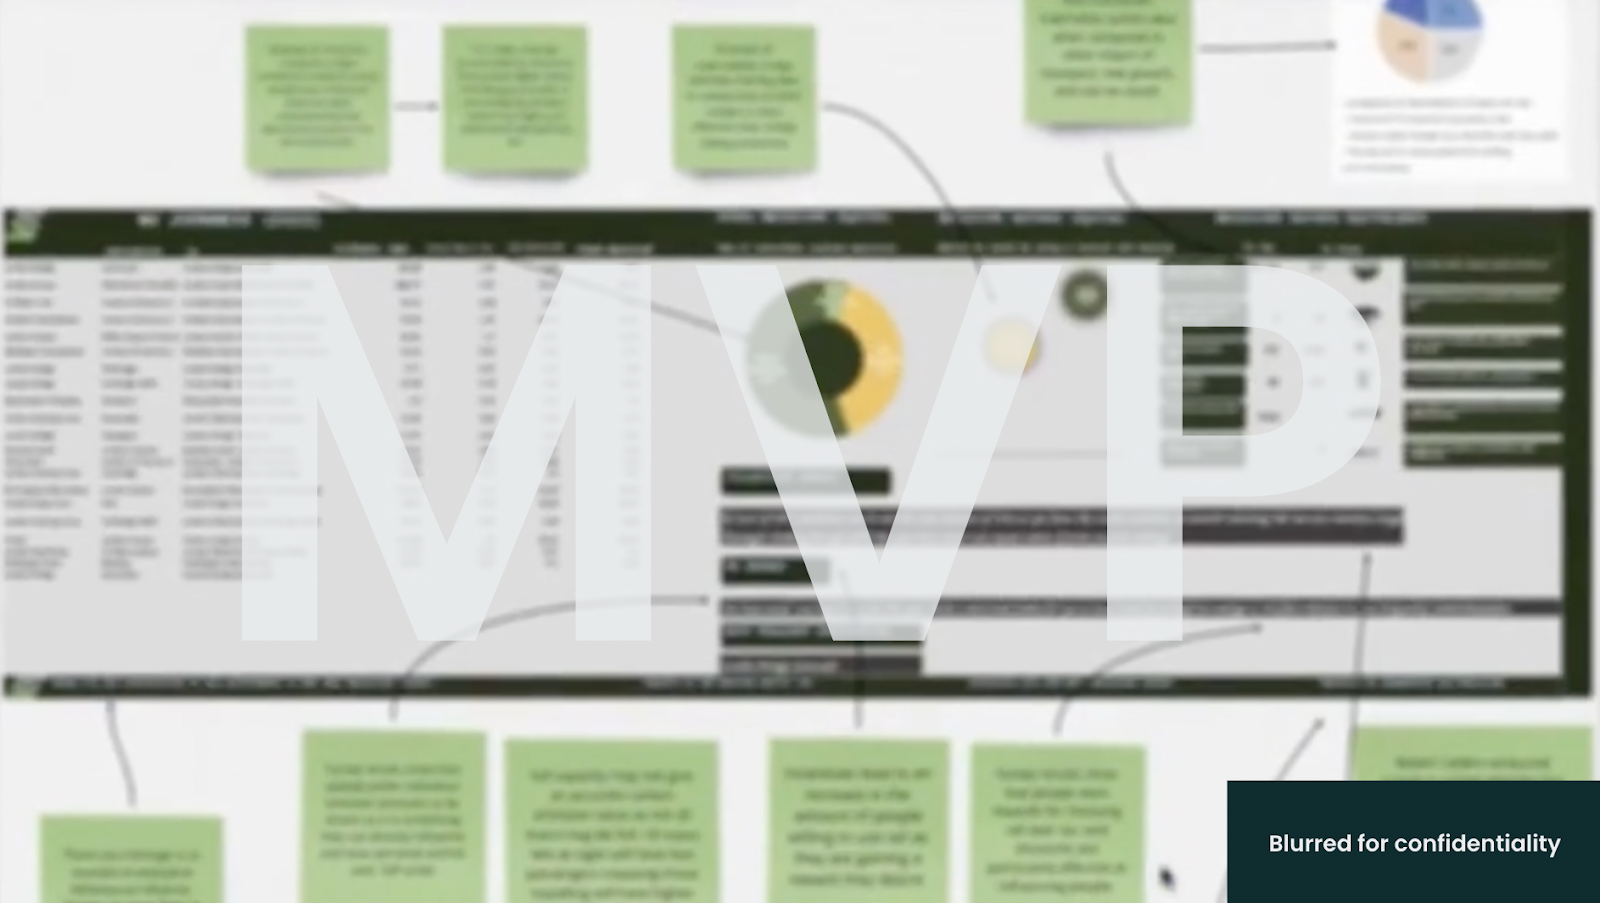
Note: Before starting the internship, Valentine had almost no experience with Excel. Eight weeks later, however, she had worked with Alex to create a responsive spreadsheet and an intuitive UI that went above and beyond our expectations.
Notable features include an incentive system that shows how many more journeys a traveller needs to take to reach a certain carbon reduction target and a rewards system that entitles travellers to a discounted trip after hitting a certain emissions benchmark.
Survey results showed that financial rewards were the most compelling — something which Valentine highlighted as an example of a ‘reinforcing loop’.
Every time a traveller chooses rail over planes and cars, their carbon footprint reduces, the rail companies generate more revenue, and the travellers get one step closer to a discounted journey. In turn, this incentivises more rail journeys, more carbon savings, and for the rail companies, the small dent in margin from the discounted ticket is offset by the increased volume of full-price bookings.
Social Levers of Behaviour Change
One of the most exciting developments that came from the carbon calculator was a way of contextualising how an individual’s decision to choose rail impacts a wider social effort to tackle climate change.
While many consumer choices are driven by how an individual thinks they could benefit from making a certain decision, Valentine and Alex were also interested in how to make travellers feel like part of something bigger than themselves. Specifically, they wanted to add a social aspect to the end of a traveller’s experience that would create a sense of comradery and combined responsibility towards reducing carbon emissions.
Smiles All Round
As the internship drew to a close, we reflected on just how much Valentine and Alex had achieved in eight weeks.
Despite the complexity of their two research questions, they stepped up to the challenge and were always eager to learn. We’re confident that their newfound skills and experience of working alongside the SilverRail team will help to springboard their career journeys and fuel their passion for the environment.
Receiving the following messages from Valentine and Alex put a big smile on our faces…
Changing the Way We Move
The conclusion of SilverRail’s climate research internship involved Valentine and Alex taking to the stage to present their carbon dashboard to our executive team.
After fending off some tricky questions and taking the team through their research journey to explain their design decisions, we were extremely impressed. So much so, in fact, that we’ve decided to implement their thinking into two major projects as a way to bring carbon data to life and promote the environmental benefits of rail.
We were particularly impressed with how Valentine and Alex brought some fresh perspectives to an age-old problem — combining their university research skills with a hunger to learn practical skills. In just eight weeks, they wore the shoes of a researcher, a data engineer, a UX designer, and even a product manager.
As SilverRail continues to change the way we move and campaign for a greener planet, we are delighted to have taken this journey with Valentine and Alex.
We are confident that their carbon calculator will play an important role in our ongoing efforts to combine technology with great design to improve the way people move.